![]()
DPS923 & MAP523
Mobile App Development for iOS
Notes Topics Weekly Resources Graded work Professor Code examplesDPS923 MAP523 Week 3 Notes
The theme for this week is to learn and practice the programming techniques that enable user interaction.
Monday plan
A brief “practice test”.
Then, the professor will guide you through the topics in the textbook.
Chapter 4: Outlets
Chapter 5: Rounds and Score
Chapter 6: Polish
Practice test
We will have a brief “practice test” today.
All tests in this course are hand-written. Pen or pencil. Answer styles will vary, but we’re mostly looking for short- to medium-length answers, and/or diagrams, and so on.
No references or resources are permitted – “closed book, open brain”. More information is on the graded work page.
The duration of each test depends upon the number of questions. Generally, about 3 to 4 minutes per question is allotted, which seems to work out OK. And, you will have choice – you will be able to answer any “x” of “y” questions.
The tested topics are both forward-looking, and review-based. The forward-looking aspect encourages you to prepare for class, by reading and using the weekly content before the class. You will be tested on comprehension, understanding, and the application of new topics. The review-based aspect enables you to show that you have the foundational knowledge and understanding needed for current and future tasks.
Code organization in a view controller
During last week’s computer-lab session, the professor briefly discussed a suggested code organization technique for use in a view controller class.
In a view controller, we suggest the following top-to-bottom organizational scheme:
- Instance variables
- Outlet declarations
- Lifecycle functions
- Action functions
When your controller code grows to hundreds of lines, this scheme will help.
Here’s how to implement this scheme: Add specially-formatted comments to separate each of the four groups/sections. Each comment begins with the string “MARK: - “. For example:
// MARK: - Instance variables
Here’s a full example of a controller that implements this scheme:
class ViewController: UIViewController {

    // MARK: - Instance variables

    var message = "Hello, world!"
    var currentValue = 12

    // MARK: - Outlets

    @IBOutlet weak var gpaValue: UITextField!
    @IBOutlet weak var gpaTitle: UILabel!

    // MARK: - Lifecycle

    override func viewDidLoad() {
        super.viewDidLoad()
        // this function was included in the new project template
        // add more code here
    }

    func doSomething(_ input: String) -> String {
        // this function was added by the programmer
        // add code here
        return ""
    }

    // MARK: - Actions

    @IBAction func programChanged(_ sender: UISegmentedControl) {
        // add code here
    }

}
When you do this, you will enjoy one more benefit while writing code. Xcode will nicely format the list of class members when you click (or Ctrl+6) the “document items” part of the jump bar.

Each group/section is separated by a horizontal line, and has a bold title.
Incidentally, this list is searchable. Just begin typing, and it will filter the list to include only those members that match the typed text.
Sweet.
Runtime crash caused by connection problems
The introduction of the outlets topic brings the increased possibility of runtime crashes/errors. New iOS programmers can get their progress stopped, and can become frustrated because the error info may not be very helpful.
We can help.
First, let’s begin with the assumption that the problem is often “connection” related - a connection between code (an action or an outlet) and an object in the view or user interface.
Next, let’s create this kind of problem. Using the just-learned Assistant Editor technique, create a new outlet connection:
- Add an object to the view. Almost any kind will be OK, a button, text field, slider, or segmented control.
- Make sure you are looking at the two-pane Editor and Assistant Editor arrangement.
- Create an outlet (click/select the object in the view, then Control+click-drag to the outlets group/section of the view controller code). Deliberately, configure the outlet with a bad name (temporarily).
- Now notice and decide that the name was bad, so delete the statement from the code file.
- Re-create an outlet, and this time, configure the outlet with the name you want it to have.
Build (compile). Notice that the task succeeded.
Now, run the app in the simulator. Boom.
Notice that Xcode shows you a nasty message in the debug area, and the left-side nav area shows the debug navigator.

Scroll to the top of the message area. The top-most text is useful to us:
2018-09-14 10:03:38.301062-0400 sep14v1[24431:1427553]
*** Terminating app due to uncaught exception 'NSUnknownKeyException',
reason: '[<sep14v1.ViewController 0x7fa10b410200> setValue:forUndefinedKey:]: this class is not key value coding-compliant for the key badName.'
The part of the message “this class is not key value-coding compliant” is a hint to us that the problem is caused by an outlet connection problem.
The key piece of info that we need is at the end of that message: “for the key badName”. We need that to locate it in the storyboard’s utilities panel area called “Connections Inspector”. On the top strip, it’s the right-most icon.
Now that you have that key piece of info, you can close the simulator app, and back in Xcode, stop the app from running, show the storyboard, and the utilities panel’s Connections Inspector.
If you remember which object that had its outlet recreated, then click on it. Otherwise, you may have to click on each object and then look at the Connections Inspector, looking for a double enties in the Referencing Outlets part of the list.

See the “badName” item? Delete it by clicking the “x” icon. Run your app again, and it should load correctly.
Use the Search Navigator
If you do not remember which object had its outlet recreated - maybe you have dozens of objects, or made many changes over a longer period of time - then you can use the Search Navigator.
Open it, type the “badname” text (from above), and press enter.

Then double-click the result in the storyboard. The Connections Inspector in the right-side utilities panel will open, and show it.

As you did above, click the “x” icon to delete it.
Wednesday plan
Continue work on Assignment 1.
Gentle introduction to debugging
As you would expect, Xcode has a debug feature.
To start the debug feature, build and run the app. The debug area is at the bottom of the middle editor area. It may not be visible until you either show it or a runtime error happens.
You can show or hide the debug area with this keyboard shortcut:
Shift+Command+Y
Some of the content that follows was adapted from the debug topics in the Xcode Help documentation.
Debug area overview
The three main components of the debug area include the debug bar, the variables view, and the console.
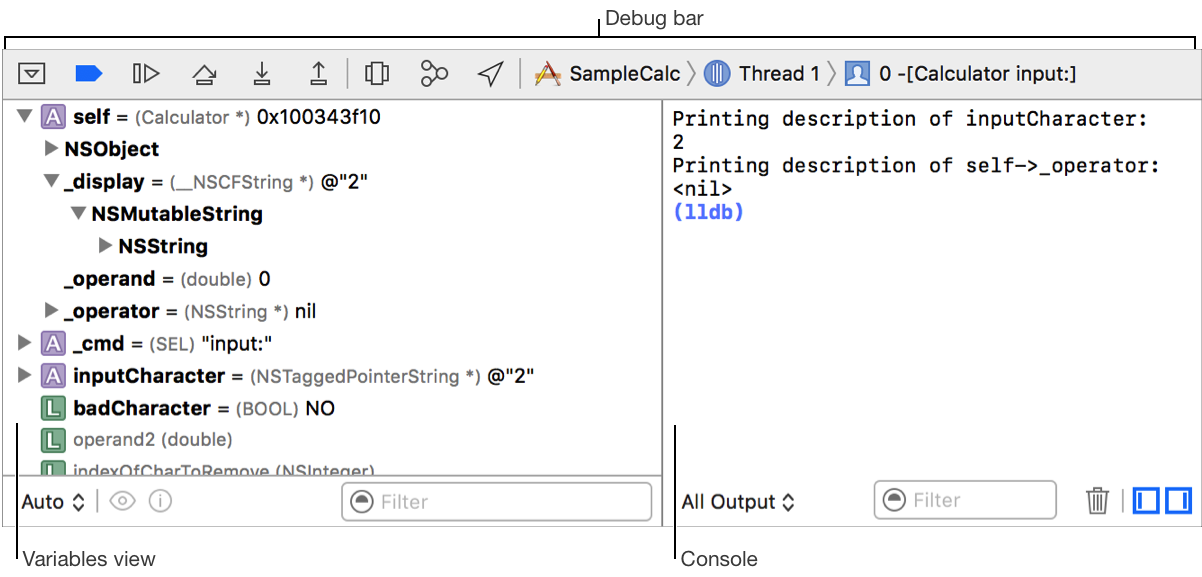
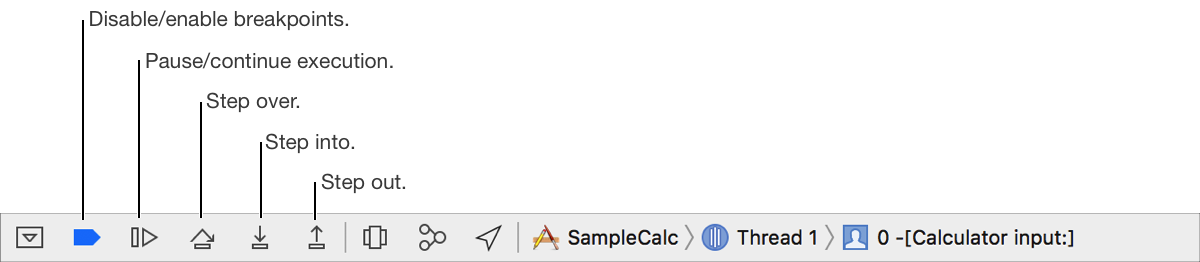
The debug bar contains buttons that disable or enable all breakpoints, control the execution of your app, enable graphical debugging of view and memory state, simulate location, and jump to stack frames.
The variables view presents the list of variables available to inspect in the scope of your present location in the code. This list is a disclosable hierarchy, revealing the values of all parts of a variable’s structure as you progressively expand the disclosure triangles.
The console contains an interactive Terminal-like text area. You use it to interact directly with LLDB, see output from use of Print Description, and work with standard input and output from your app.
The debug bar in the debug area lets you control the execution of your running app. The debug area automatically opens when you build and run your app. (More info…)
Get the sample app
From the code example repository, get the AppWithErrors project. It’s in the Week 3 folder.
View variables
You can view the contents of variables. Your professor will demonstrate this technique.
For more information, see the Xcode Help document.
Manage breakpoints
Breakpoints can be added or removed in a source code file, or by using the breakpoints navigator. Your professor will demonstrate this technique.
For more information, see the Xcode Help document.
Add a catch-all exception breakpoint
Some runtime errors are not so easy to find in the debug area, because they’re caused by something deeper in the framework or foundation code. (That code is good-quality error-free code, but errors can happen when bad data and/or a problematic execution context exists.)
As a result, it’s a good idea to add an “exception breakpoint” to your project. If an error happens, execution will stop just BEFORE the problem code is executed. Then, you can see what code is being run, and you can step through the statements.
This section of the Xcode Help document shows how to add an exception breakpoint, but here is the brief how-to:
- In your project, in the Breakpoints Navigator, click the add icon (plus + sign) at the bottom.
- Choose “Exception Breakpoint”. Accept the defaults by clicking outside the popup (or by pressing the Esc key).
This week’s Swift focus
Your professor will walk you through the logic for the updateResultText function, using a Swift playground.
Learning resources
iOS Apprentice
Chapters 4, 5, 6